04 · WEB GIS APPLICATIONS
Maps that explain
Web applications that put data on the map to explore, compare and decide — with the same visual care as a design piece.
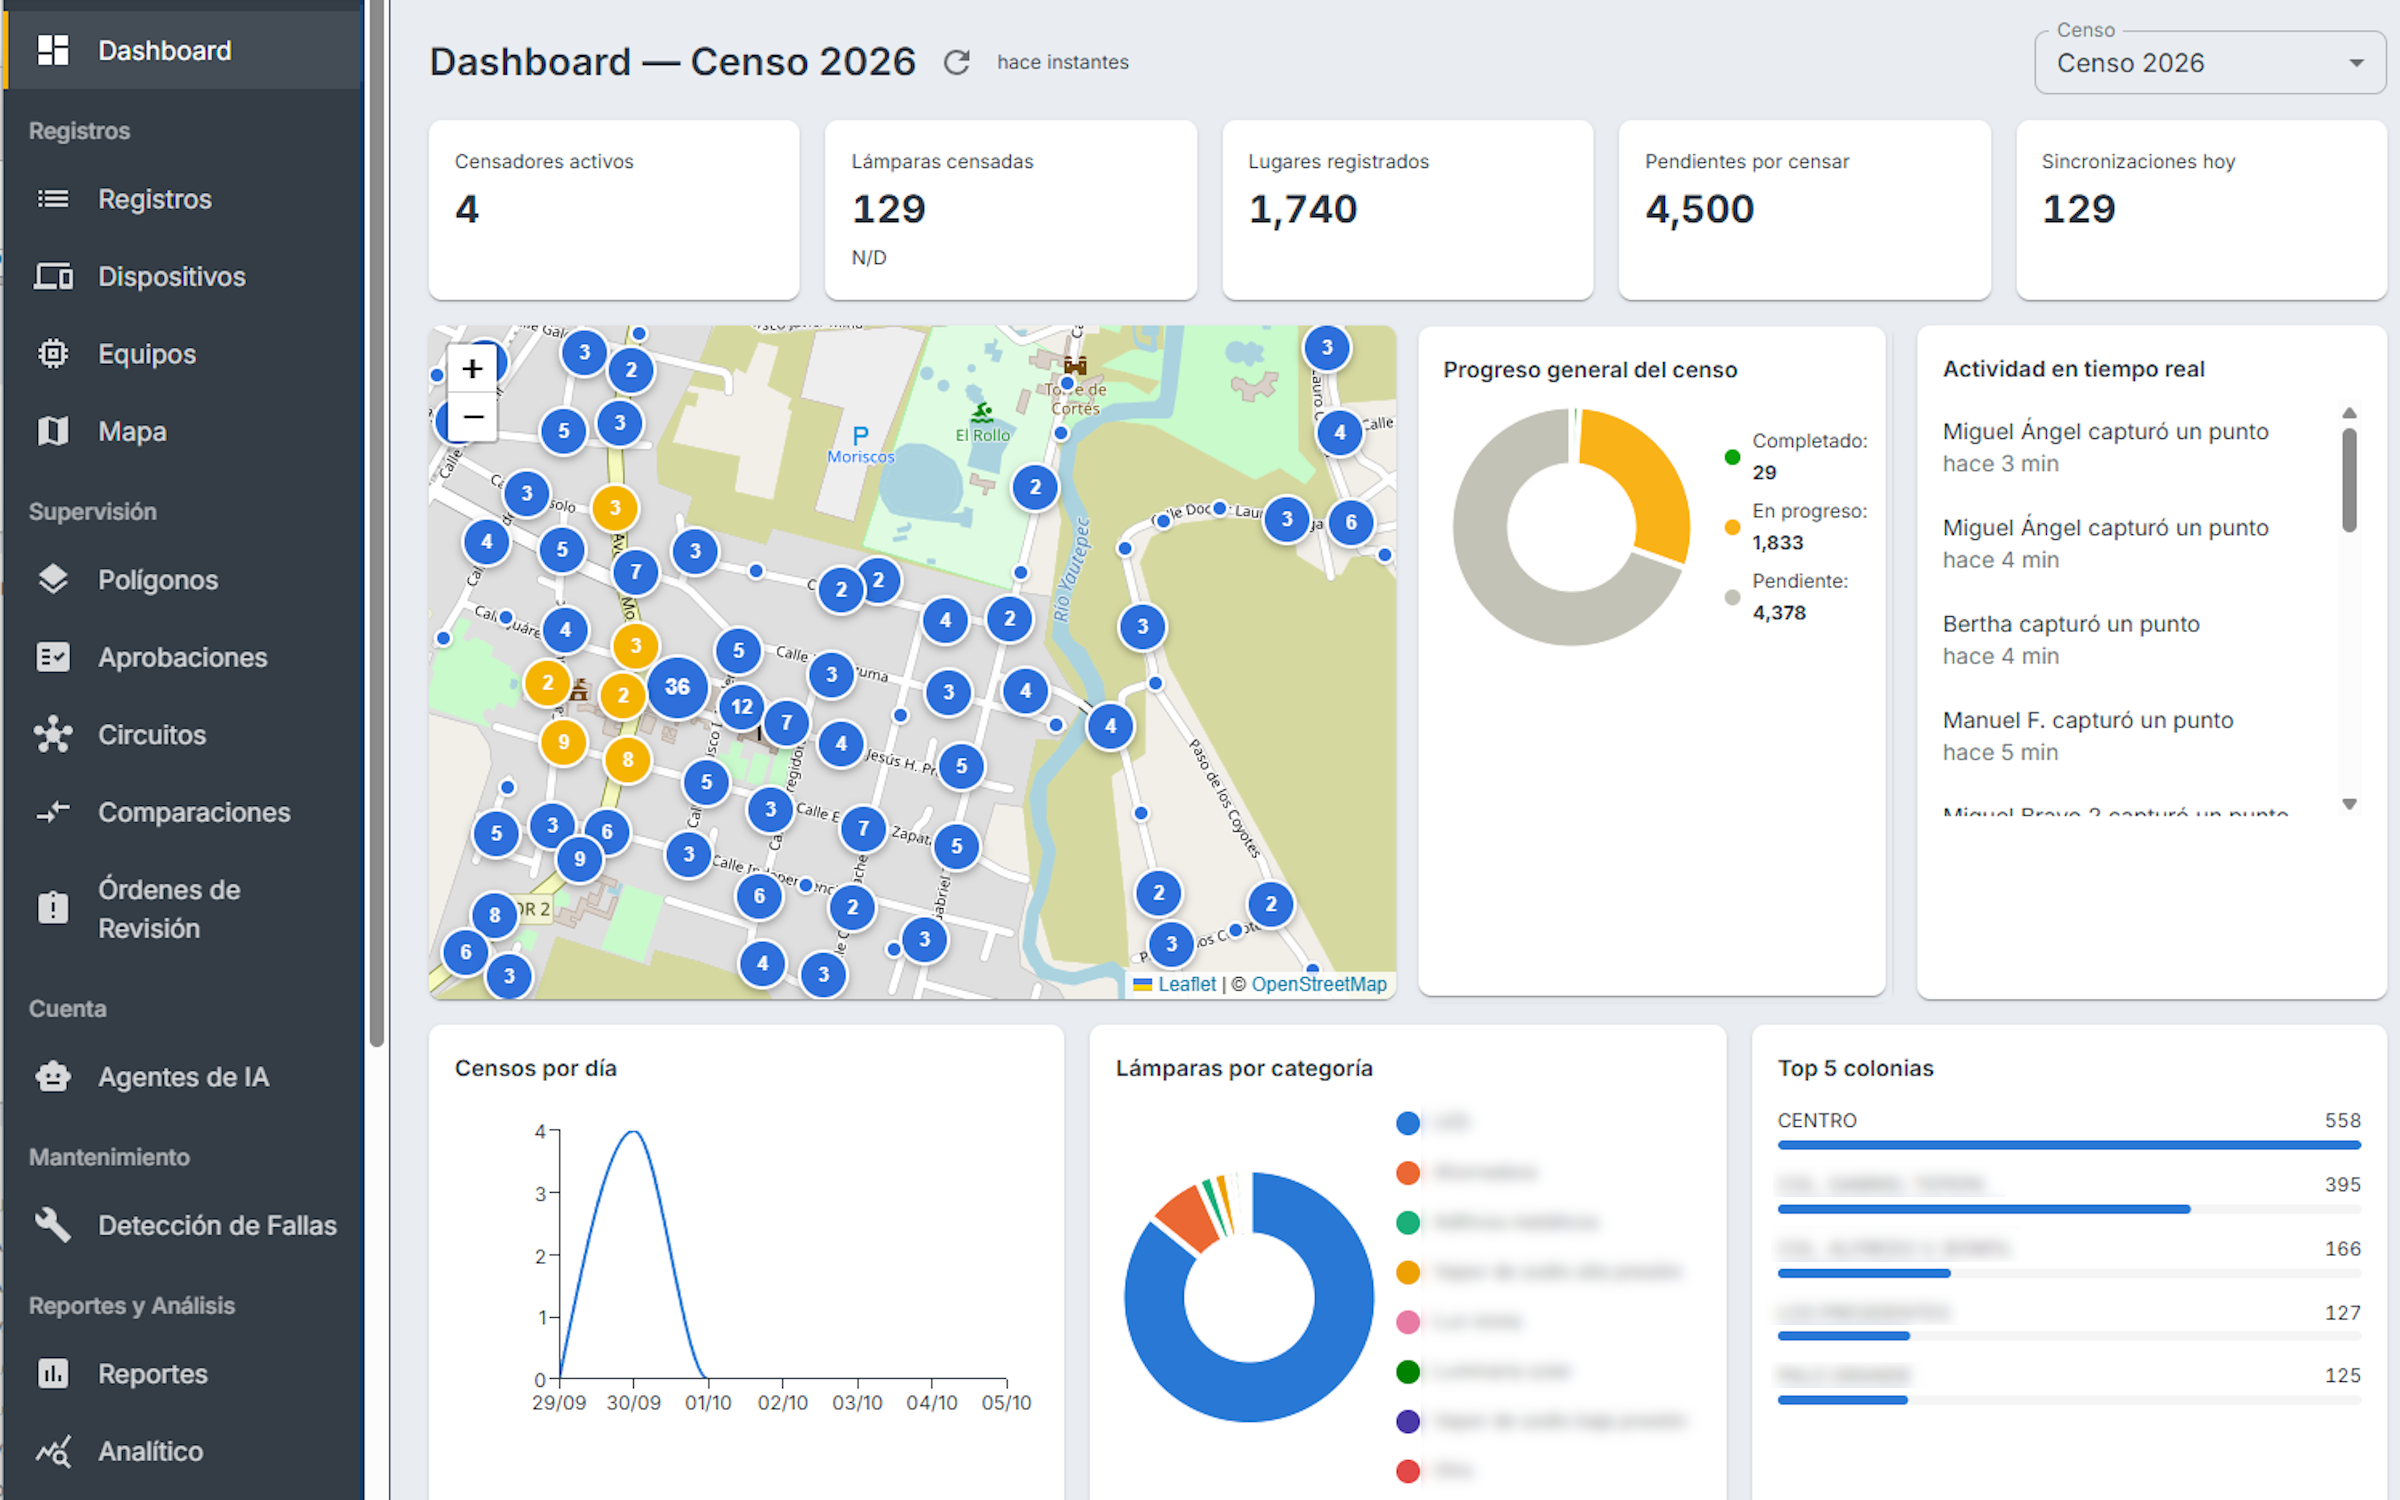
THE CHALLENGE
Infrastructure data usually lives in spreadsheets, KML files and invoices that don't match one another. With thousands of scattered points, it's hard to see what's there, where it is and what it costs.
THE CONCEPT
If a piece of data has a location, it belongs on a map. Every map should answer one specific question: what changed, what's missing or what's extra.
THE SOLUTION
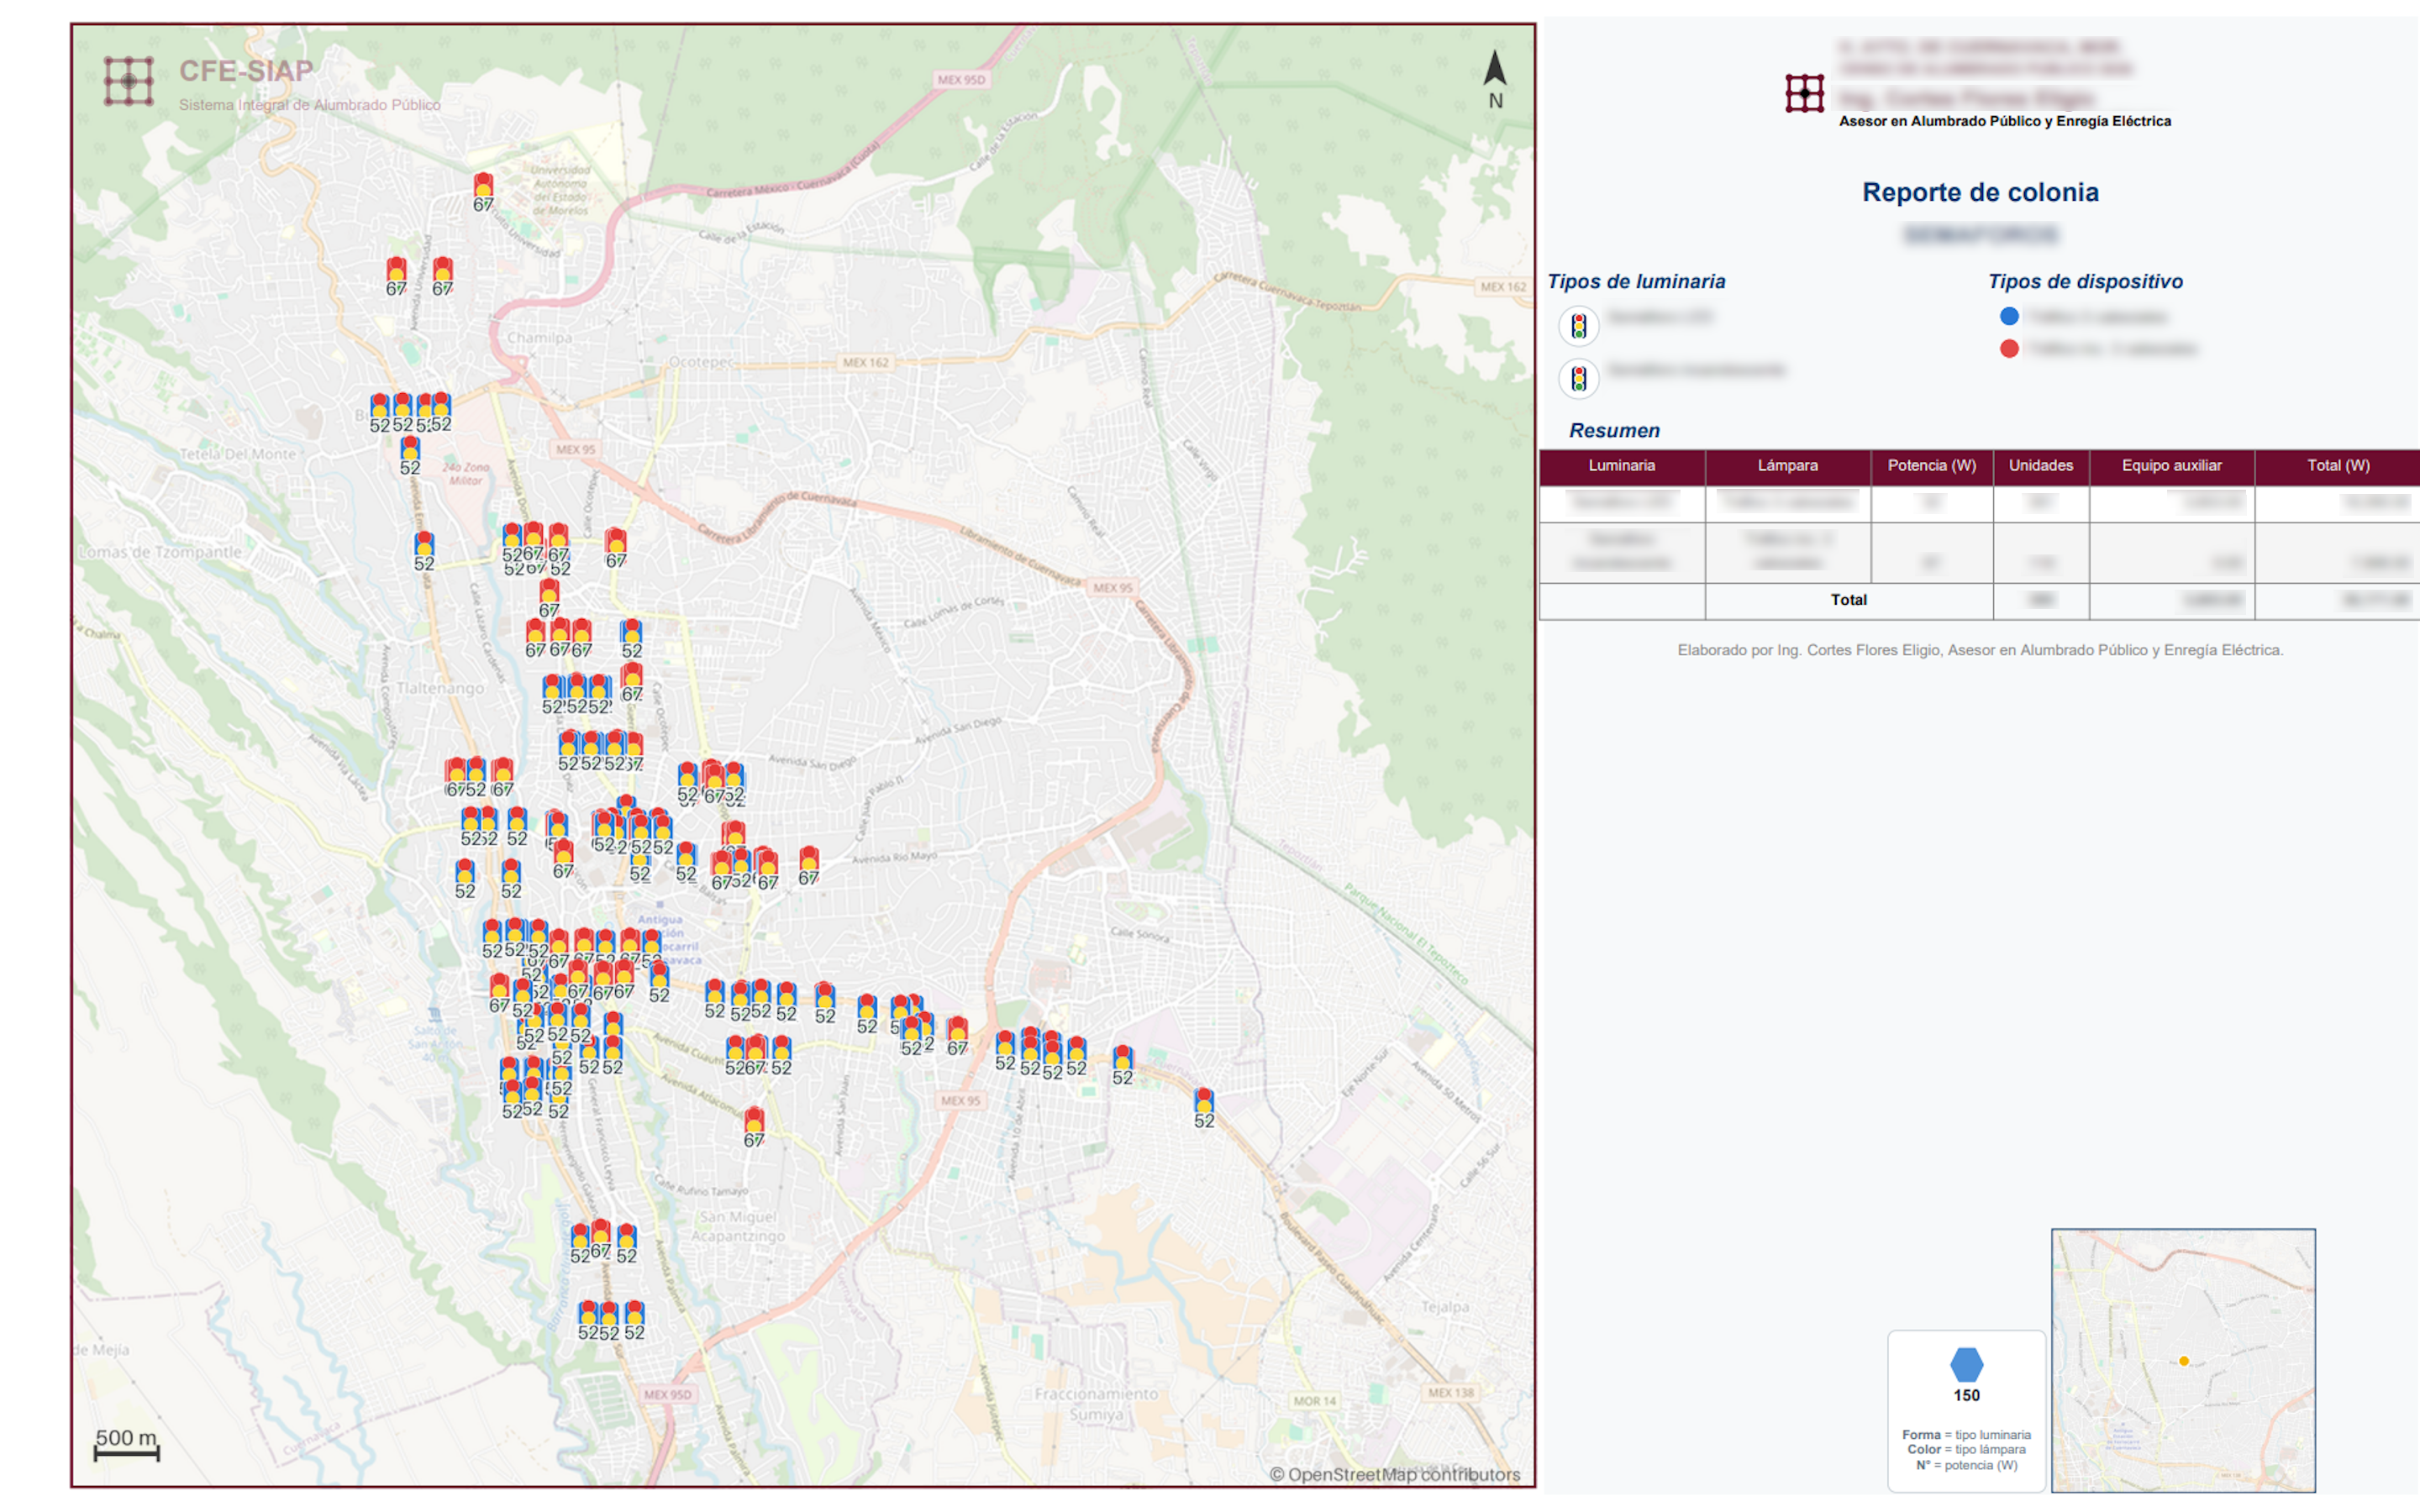
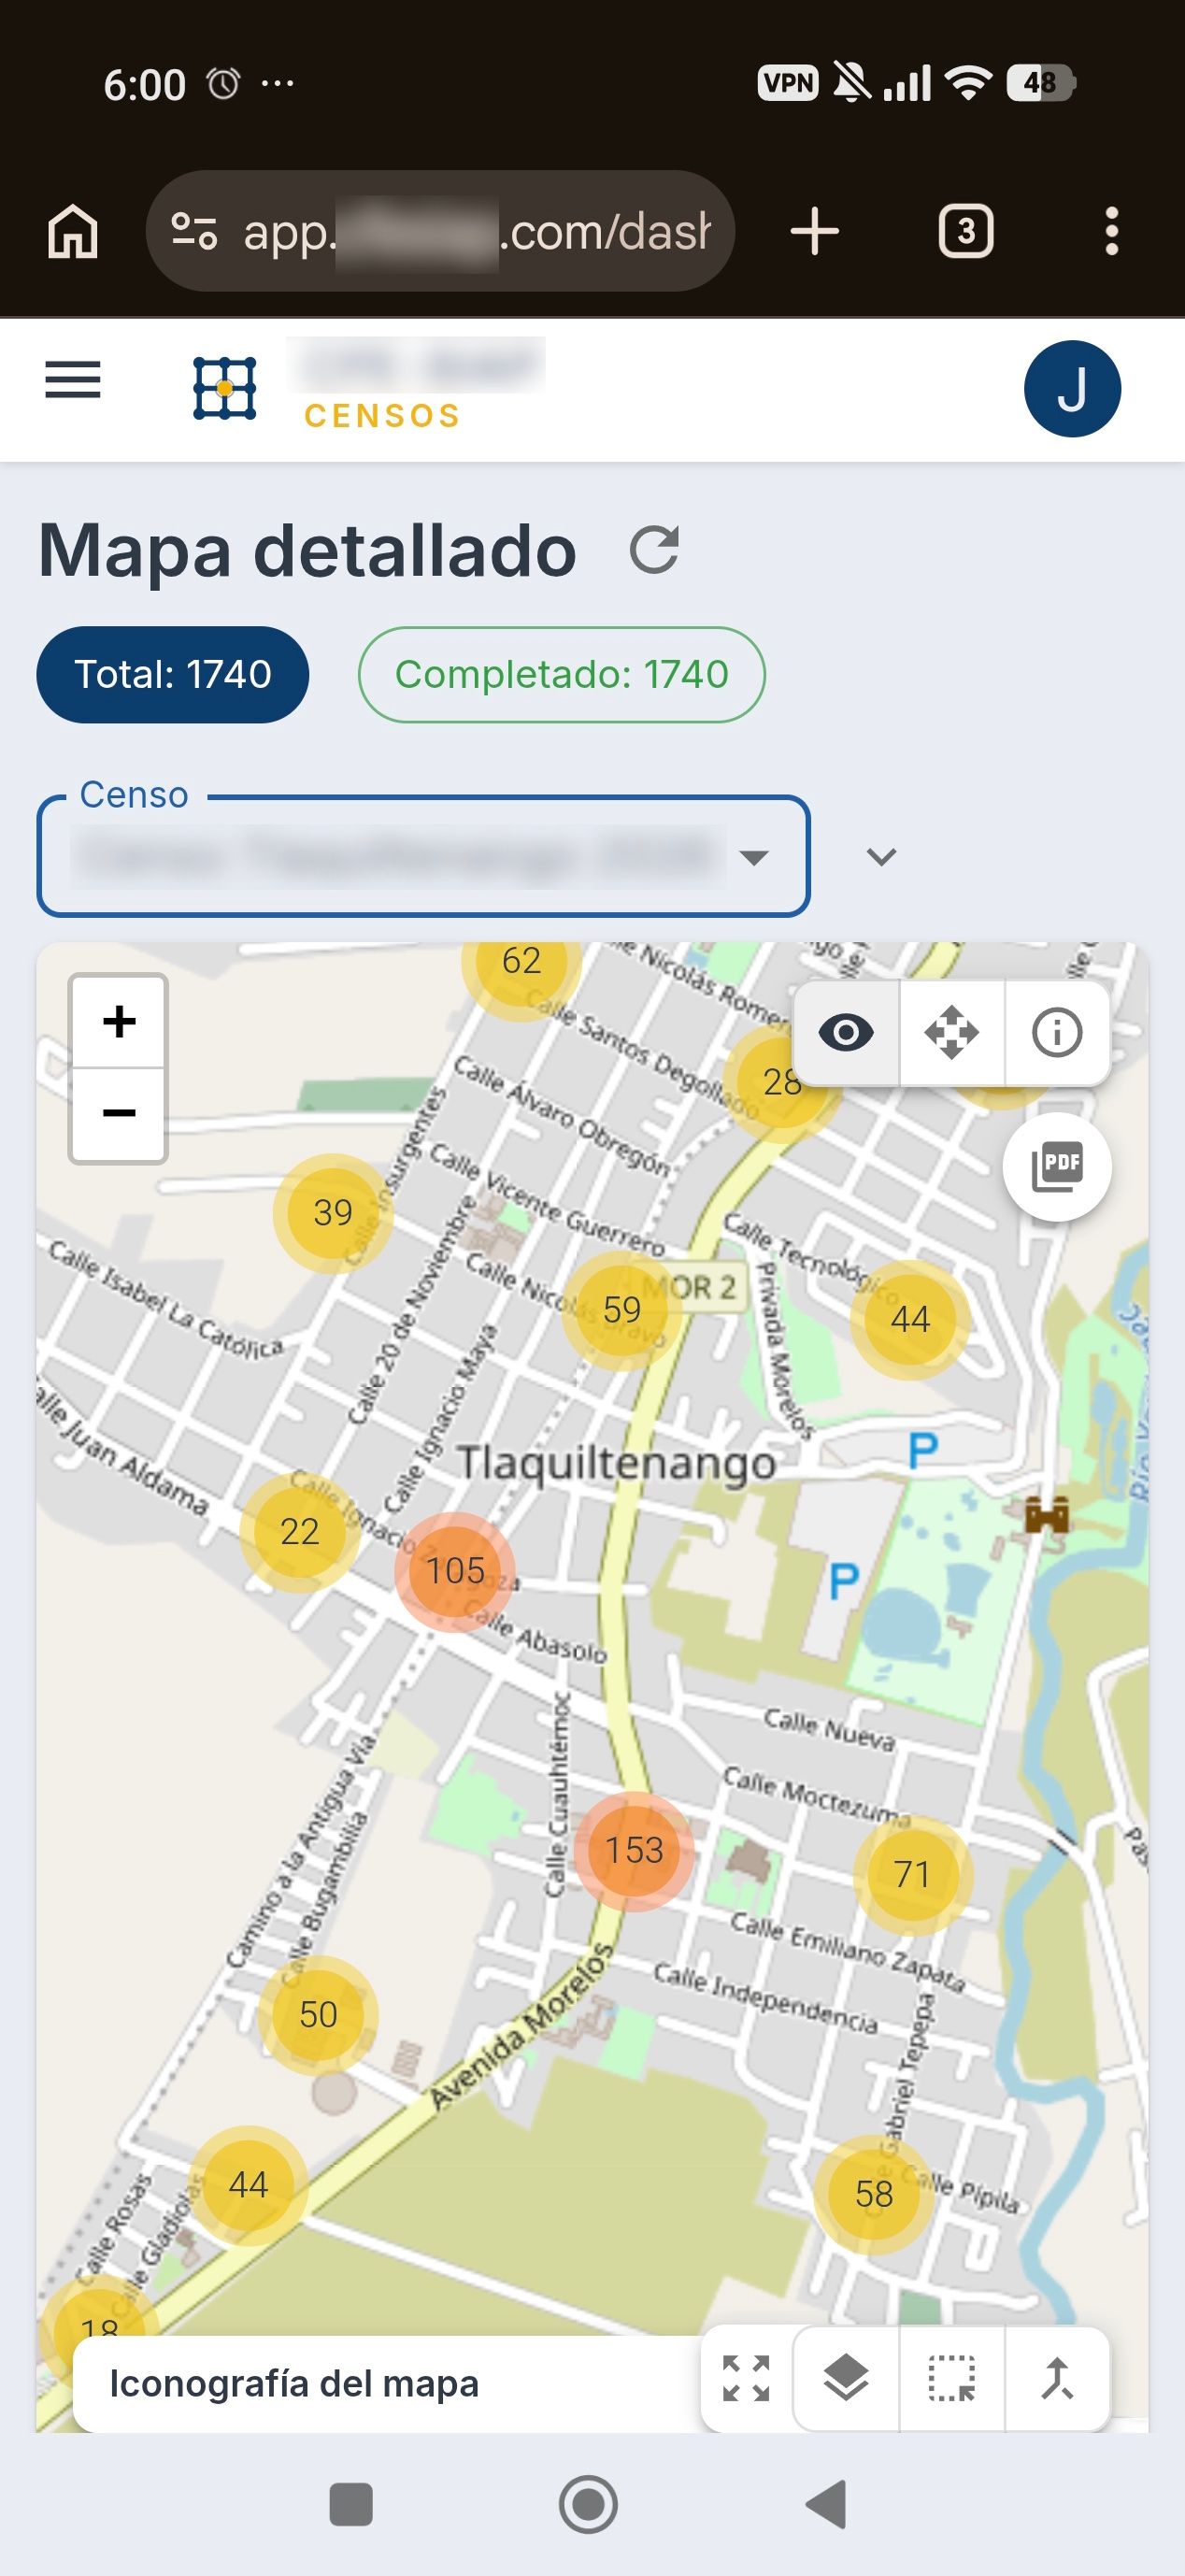
A web dashboard with a map at its center, where surveys are searched, filtered and edited. Right there, they are compared with earlier surveys and turned into reports ready to hand over.
THE PROCESS
We import the existing sources: Excel, KML, registries and others.
We clean the data and put it on the map: we group it by polygon and merge duplicates by GPS proximity.
We design a map and a report for each question.
We publish it with role-based access: administrator, supervisor or analyst.
APPLICATIONS
Onion Skin
Overlays two surveys and shows what was added, removed or changed.
PDF maps
Reports by polygon, neighborhood or meter, generated in the background.
Polygon tools
Draw shapes, smooth their edges and classify zones.
Dashboards
Survey progress, supervision and energy use.
Audit
Reports by group that check what was surveyed against what was billed.
We never use client brands without their permission.
CONTACT
Let's make something extraordinary.
Tell us about it and we'll reply by email.